Learning System Design #9: ClickHouse — Why Analytical Databases Are Absurdly Fast
Ninth part of the “Learning System Design” series! This time — ClickHouse. The columnar database that scans a billion rows in under a second on a single laptop and powers the analytics of Plausible, PostHog, SigNoz, CloudFlare Radar, and a long list of quant trading shops.

I got curious about ClickHouse when I realized every modern observability and product analytics tool I respected was built on top of it. Grafana Cloud, PostHog, Signoz, Uber’s M3 — same engine underneath. So I spent some time digging into what makes it tick, and honestly, the design is beautiful. It’s a rare case where “100× faster than Postgres” is not marketing but actual everyday experience on analytical queries.
The Mental Model
Before anything else, internalize this:
ClickHouse is not a replacement for your transactional database. It’s the query engine you bolt onto it.
Postgres/MySQL/Mongo holds the source of truth with ACID transactions. ClickHouse holds a denormalized, append-only copy optimized for scanning billions of rows in milliseconds. You stream events into it (via Kafka, CDC, batch loads) and hammer it with analytical queries.
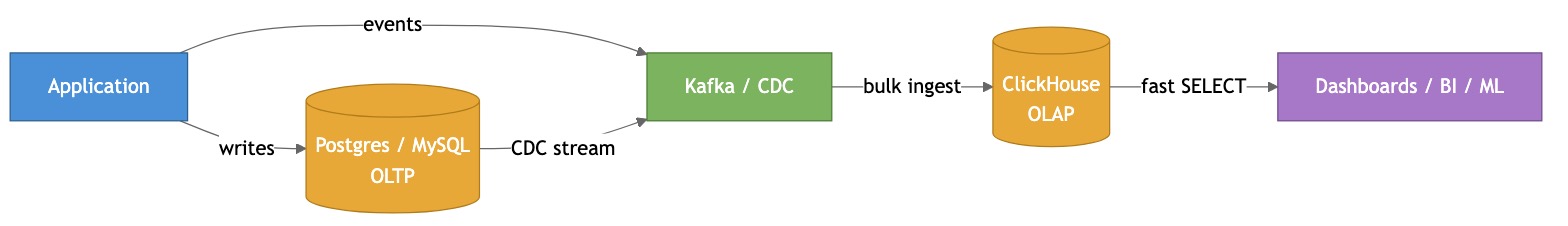
If you try to use ClickHouse as your primary DB for a CRUD app, you’ll hate your life. Every UPDATE is a rewrite of a whole data block. There are no row-level locks. There’s no referential integrity. It’s fundamentally append-optimized — and that’s the feature, not the bug.
Why Is It So Fast?
The speed isn’t one trick. It’s the compounding of about a dozen tricks, each giving 2-5× improvement. Multiplied together, you get orders of magnitude.
Columnar storage
Row stores like Postgres keep whole rows together. Column stores like ClickHouse flip that — each column is its own file on disk.
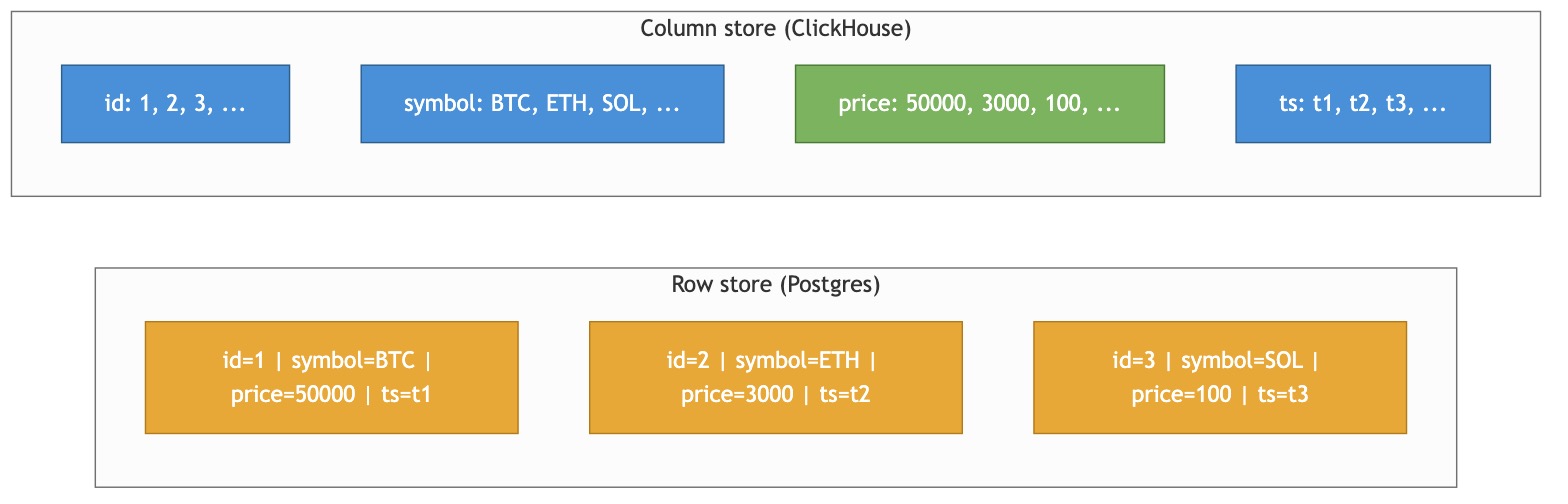
When you run SELECT avg(price) FROM trades, Postgres has to read the entire row (id, symbol, price, ts, exchange, volume, …) and throw away 95% of it. ClickHouse reads only the price file. On wide tables with 30+ columns, this alone is a 10-20× win.
A side effect: adjacent values in the same column are similar in type and often in magnitude, which leads directly into the next trick.
Aggressive compression
Adjacent values in a column are similar, so they compress extremely well. A timestamp column with a trillion rows may compress 100:1. You can stack codecs per column:
CREATE TABLE trades (
    ts        DateTime64(9) CODEC(Delta, ZSTD(3)),
    symbol    LowCardinality(String),
    price     Float64       CODEC(Gorilla, LZ4),
    volume    UInt32        CODEC(T64, LZ4)
) ENGINE = MergeTree ORDER BY (symbol, ts);
- Delta — stores differences between consecutive values (perfect for timestamps)
- Gorilla — Facebook’s float compression (perfect for prices, metrics)
- T64 — efficient for small-range integers
- ZSTD — higher ratio than LZ4, slower
Hidden gem: stacking Delta + ZSTD on timestamps often compresses to ~1-2 bytes per value.
Vectorized execution
Instead of processing one row at a time, ClickHouse processes chunks of 65,536 values. These chunks fit in L1/L2 CPU cache. The inner loops auto-vectorize into SIMD instructions (SSE, AVX2, AVX-512). One AVX-512 instruction adds 16 floats in parallel.
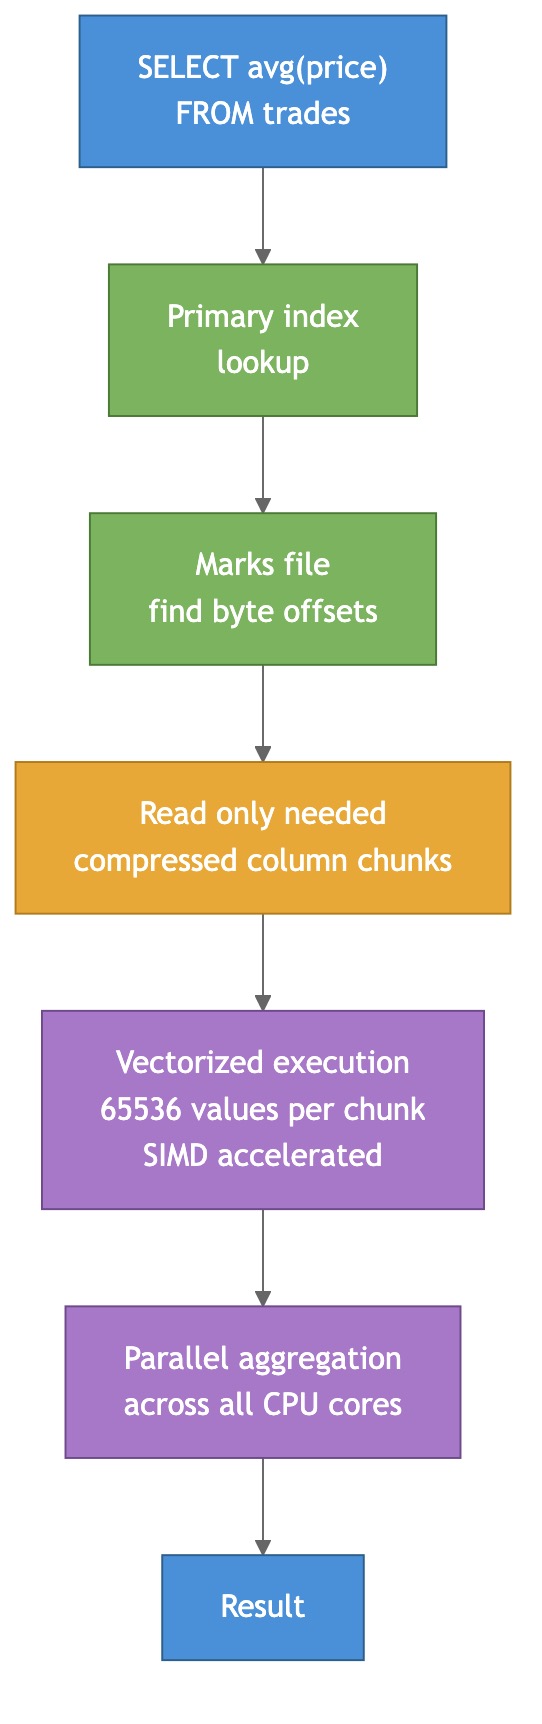
Sparse primary index
ClickHouse doesn’t index every row. It marks one row per “granule” (default 8,192 rows) in a tiny index that fits entirely in RAM. A trillion-row table has ~120 million index entries — small enough to keep in memory without breaking a sweat.
No random I/O, no MVCC overhead
Data on disk is sorted by the table’s ORDER BY key. Queries that filter on the prefix of this key read contiguous byte ranges — pure sequential I/O. Inserts are immutable blocks; “updates” are async background merges. No row-level versioning tax. Removes gigantic amounts of bookkeeping traditional DBs carry.
MergeTree — The Engine You’ll Actually Use
Unlike Postgres, where tables all behave the same, ClickHouse has ~20 table engines that radically change semantics. There are engines that dedup on merge, auto-sum numeric columns, read from Kafka, query S3 in place. But 95% of the time you want MergeTree.
CREATE TABLE trades (
    ts        DateTime64(9),
    symbol    LowCardinality(String),
    price     Float64,
    volume    UInt32
)
ENGINE = MergeTree
PARTITION BY toYYYYMM(ts)
ORDER BY (symbol, ts)
TTL ts + INTERVAL 5 YEAR
SETTINGS index_granularity = 8192;
Three things matter here:
ORDER BY is critical. It defines how data is physically sorted on disk and which filters get fast. Rule: put low-cardinality columns first, high-cardinality last. (symbol, ts) is great because symbol has thousands of values and ts has billions. Queries filtering by symbol hit contiguous data.
PARTITION BY is for data lifecycle, not speed. You partition by month so you can DROP PARTITION '202401' to delete old data instantly. Don’t go fine-grained — keep total partitions under ~1000 per table or merge performance tanks.
TTL is magic. This single feature replaces cron jobs, archival pipelines, and half of ElasticSearch’s ILM:
TTL ts + INTERVAL 30 DAY DELETE,
    ts + INTERVAL 7  DAY TO VOLUME 'cold',
    ts + INTERVAL 1  DAY RECOMPRESS CODEC(ZSTD(17));
Hot data on NVMe, warm on SSD, cold on S3, deleted after 30 days — all declarative.
Data Types Worth Knowing
LowCardinality(String) — the free lunch. Wrap any string with up to ~10k distinct values in it. Internally ClickHouse builds a dictionary and stores the data as tiny integer indexes. Queries become 5-10× faster and storage drops 5-20×. Use it on anything with repeated values: exchange, country, event_type, log_level.
Nullable(T) — avoid if possible. Adds a separate bitmap column for null flags. Queries get slower. Prefer sentinel values (0, -1, epoch=0) where it makes sense.
Native high-precision types. DateTime64(9) for nanoseconds, Decimal(38, 18) for money, UUID, IPv4, IPv6 with native storage and functions, Array(T), Map(K,V), Nested(...) for rich composites. You rarely need to reach outside the type system.
Using It from Go
The official driver is github.com/ClickHouse/clickhouse-go/v2. The key thing: always batch inserts. ClickHouse is terrible at one-row-at-a-time inserts — every insert creates a new “part,” and too many small parts kill merge performance.
conn, _ := clickhouse.Open(&clickhouse.Options{
    Addr: []string{"127.0.0.1:9000"},
    Auth: clickhouse.Auth{Database: "default", Username: "default", Password: "secret"},
    Compression: &clickhouse.Compression{Method: clickhouse.CompressionLZ4},
    MaxOpenConns: 10,
})

batch, _ := conn.PrepareBatch(ctx, "INSERT INTO trades")
for _, t := range trades {
    batch.Append(t.Ts, t.Symbol, t.Price, t.Volume)
}
batch.Send()
Target batch size: 10k–1M rows, or ~10 MB. Smaller than that and you’re leaving throughput on the table.
If your data arrives one row at a time from many producers (and you can’t batch on your side), use server-side async inserts — ClickHouse buffers rows and flushes them as big batches:
ctx := clickhouse.Context(context.Background(), clickhouse.WithSettings(clickhouse.Settings{
    "async_insert":          1,
    "wait_for_async_insert": 0,   // fire-and-forget
}))
conn.Exec(ctx, "INSERT INTO trades VALUES (?, ?, ?, ?)", ...)
For queries, streaming is your friend. Don’t Select a billion rows into a slice — iterate with rows.Next() and process one row at a time.
Where It Shines
The short list of workloads where ClickHouse is basically the right answer:
- Time-series analytics — metrics, traces, events, tick data. Ingests millions of rows/sec per node
- Real-time BI dashboards — queries that take minutes on Postgres return in <1s
- Observability — 5-10× cheaper than Elasticsearch on storage, 10-100× on aggregations. SigNoz, OpenObserve, HyperDX are all ClickHouse-powered
- Product analytics — funnels, retention, cohorts.
windowFunnelandretention()built-in - Fintech / tick data —
DateTime64(9), ASOF JOIN, Gorilla compression. Jane Street, Virtu, crypto exchanges - Ad-tech — trillions of impressions/clicks with real-time reporting
- Security analytics / SIEM — replaces Splunk at 10-100× lower cost
Where It’s the Wrong Tool
Just as important — don’t force it:
- Transactional workloads — no ACID transactions, no row locking. Use Postgres
- CRUD apps — every UPDATE rewrites a part. You’ll suffer
- Low-volume data (<10M rows) — Postgres with a good index beats it and is 10× simpler
- Hot single-row lookups — sparse indexes mean reading at least one full granule. Use Redis or Postgres
- Full-text search (primary use case) — Elasticsearch/Meilisearch win on relevance ranking
- Heavy geospatial / graph queries — PostGIS and Neo4j are purpose-built
Rule of thumb:
Single-row CRUD with transactions?     → Postgres/MySQL
Key-value point lookups?                → Redis/DynamoDB
Full-text search?                       → Elastic/OpenSearch
Embedded / notebook-scale?              → DuckDB / chDB
Large-scale aggregation over events?    → ClickHouse ✓
Common Pitfalls
A handful of things that trip up newcomers:
- Tiny inserts — inserting row-by-row creates thousands of small parts. Batch or use async_insert
- Too many partitions — per-day partitioning for 10 years = 3,650 partitions per table. Keep it under ~1000
- Nullable everywhere — adds a whole extra column of null flags. Use sentinels when possible
- Forgetting
LowCardinality— free 5-10× speedup on repeated strings, and people forget it constantly - Wrong
ORDER BY— putting high-cardinality columns first defeats the sparse index. Low-card first, high-card last - Using MUTATIONS like UPDATE statements — they’re async, they rewrite parts, they’re not what you want. Use
ReplacingMergeTreefor dedup, or just accept append-only
Hidden Gems
Two features nobody talks about but are ridiculously useful:
clickhouse-local — runs the ClickHouse engine as a CLI over local files. Think “SQL-powered awk on steroids.” No server required:
clickhouse local --query "
  SELECT symbol, avg(price)
  FROM file('trades.parquet', Parquet)
  GROUP BY symbol
  ORDER BY 2 DESC LIMIT 10
"
Reads Parquet, CSV, JSON, Avro, ORC, Arrow. Can write to S3. It’s my new favorite data-wrangling tool.
chdb — embedded ClickHouse as a Python/Go library. Single binary, no server, full query engine. Perfect for CLI tools, data pipelines, or one-off analysis at notebook scale.
Summary
ClickHouse earns its reputation by stacking a dozen optimizations on top of each other — columnar storage, aggressive per-column compression, vectorized SIMD execution, sparse primary indexes, parallel scans across all cores, no MVCC overhead. Individually small; together, a 100-1000× win on analytical queries.
The mental model is simple: it’s not a Postgres replacement, it’s the analytics query engine you bolt onto your Postgres. Stream events in, hammer it with GROUP BY and time-windowed aggregations. MergeTree handles 95% of cases. LowCardinality, Delta+ZSTD codecs, and sensible ORDER BY get you most of the speed. Always batch inserts. Don’t treat it like OLTP.
If you’re building dashboards, observability, product analytics, fintech, or anything with “billions of timestamped events” in the requirements — ClickHouse is almost certainly the right pick.
More detailed notes with all the deep dives (architecture internals, table engines, materialized views, tick-store schemas, real-world backtester patterns, Kafka ingestion, sharding and replication):
https://github.com/sadensmol/learning_system-design/blob/main/clickhouse-guide.md
Thanks for reading! More system design topics coming in the next parts of the series.
PS: have you replaced Postgres analytics with ClickHouse on a real project? What broke, what got 100× faster, what surprised you? I’d love to hear the war stories.